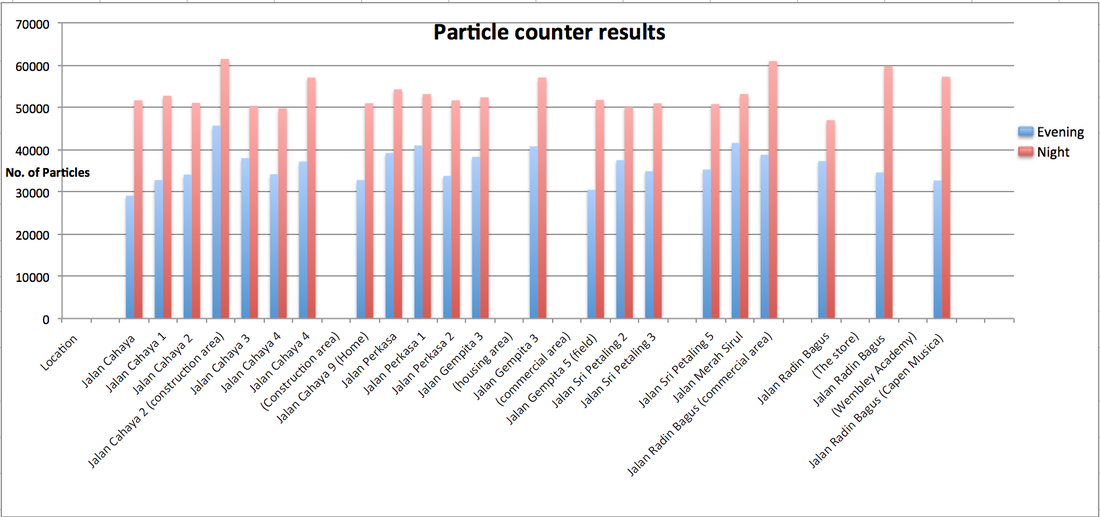
Particle counter results
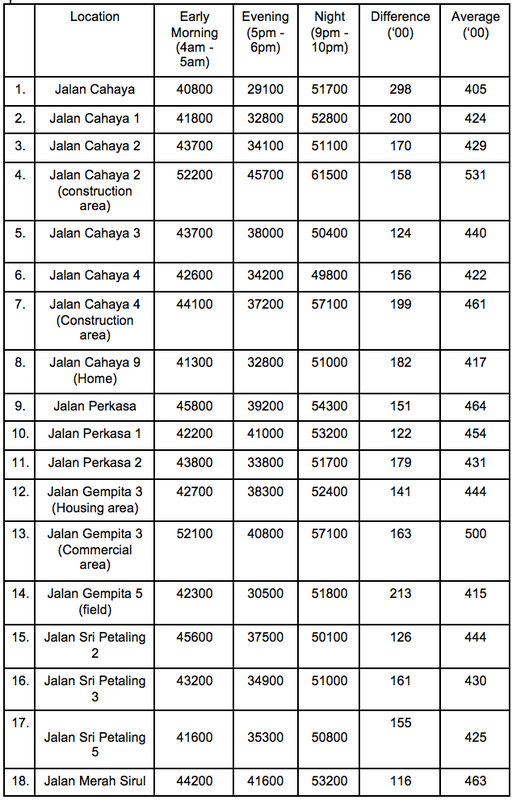

Figure 1.1
Mathematical formulas
For difference : Night - Evening
For average : ( Evening + Night) / 2
From the table above, we can see that the results differs a lot during the day and night. The highest difference was from Jalan Cahaya at 29800. This has proven my hypothesis of air quality in the day being worst to be wrong. As I mentioned on ABOUT, I assumed the air quality during the day to be worst because there will be more car and industrial/construction activities.
The reasons for this to happen is due to the influence of high pressure during the day and low pressure at night. During the day, particles that are suppressed on the ground whereas when the night enters, the pressure is lowered which cause the particles to move freely in the air. This explains why the the number of particles collected are highest at night time.
Another reason is because the temperature at nighttime is lower, therefore the emissions are trap easily which cause pollutants to remain in the air for a longer period of time. This also indicate that when the temperature is low, the higher the number of air particles will be in the air. Mainly, the air particles in the air at night are produced during the day. However, the other cause of high number air pollutant is the massive usage of air condition. It is responsible for high number of air pollutant because it increases the volume of carbon dioxide and other greenhouse gases to be released. In my residence area, almost every house hold operates its air condition every night. This shows evidence why the number of air pollutants collected at night is higher.
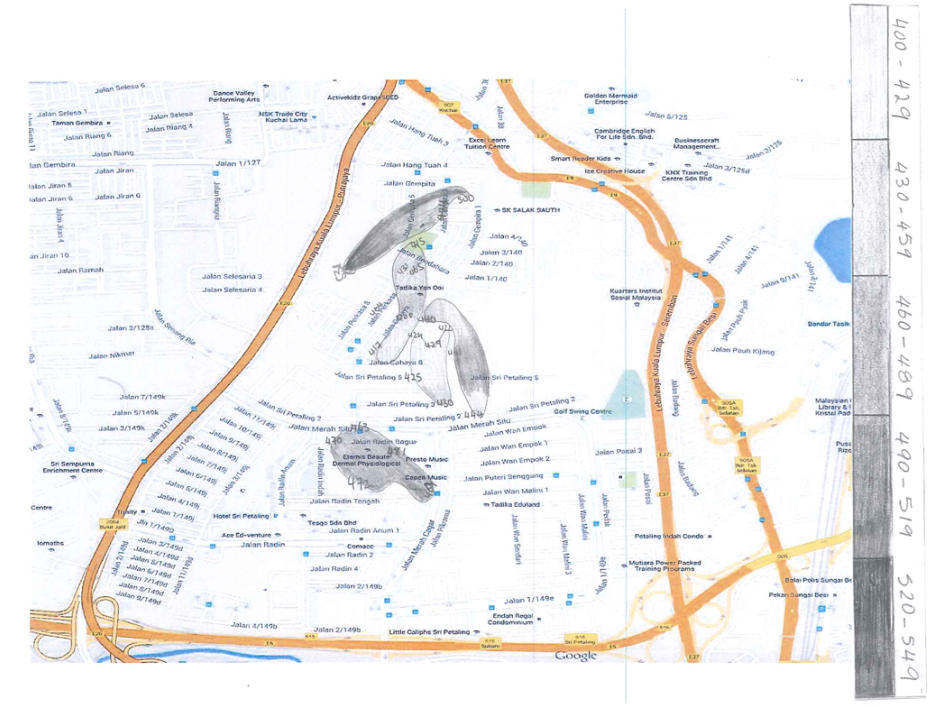
Map 1
The map above is used to present the severity of air quality in Taman Salak Selatan. By using the provided scale on the right, viewers are able to determine which area has the best and worst air quality by looking at different shades of the colour. The lightest shade shows a better air quality whereas as darker shades shows deteriorating air quality. The numbers that are used on this map are the average that I've obtained by adding the numbers of evening and night and divide it by two from Figure 1.1.
From the map, the area at the bottom was in the range of 490-519. The possible reason for this could be because many car activities took place as it is a commercial area. There are restaurants, shops, tuition centres, music centres and The Store( super market). In comparison, Jalan Cahaya 1,2,3, 4 and 9 have lower air pollutants. This is shown on the map with lighter shades of grey which range between 400 -459. The reasons that lead to this could be because there are less car activities compared to Jalan Radin Bagus commercial areas.

Map 2
From Map 1, we could only tell some locations have higher number of air pollutants by looking at the scale. However, with the help of satellite map, we can now recognise the type of areas of location and identify possible factors that might caused a high number of air pollutant in certain areas. For example, in Taman Salak Selantan and Sri Petaling, residential areas are represented in small blocks of orange/dark colours where as the supermarket, carpark and commercial shops are represented in white blocks. On the map, brown areas represent unused land or construction sites while greens are often forest or gardens.
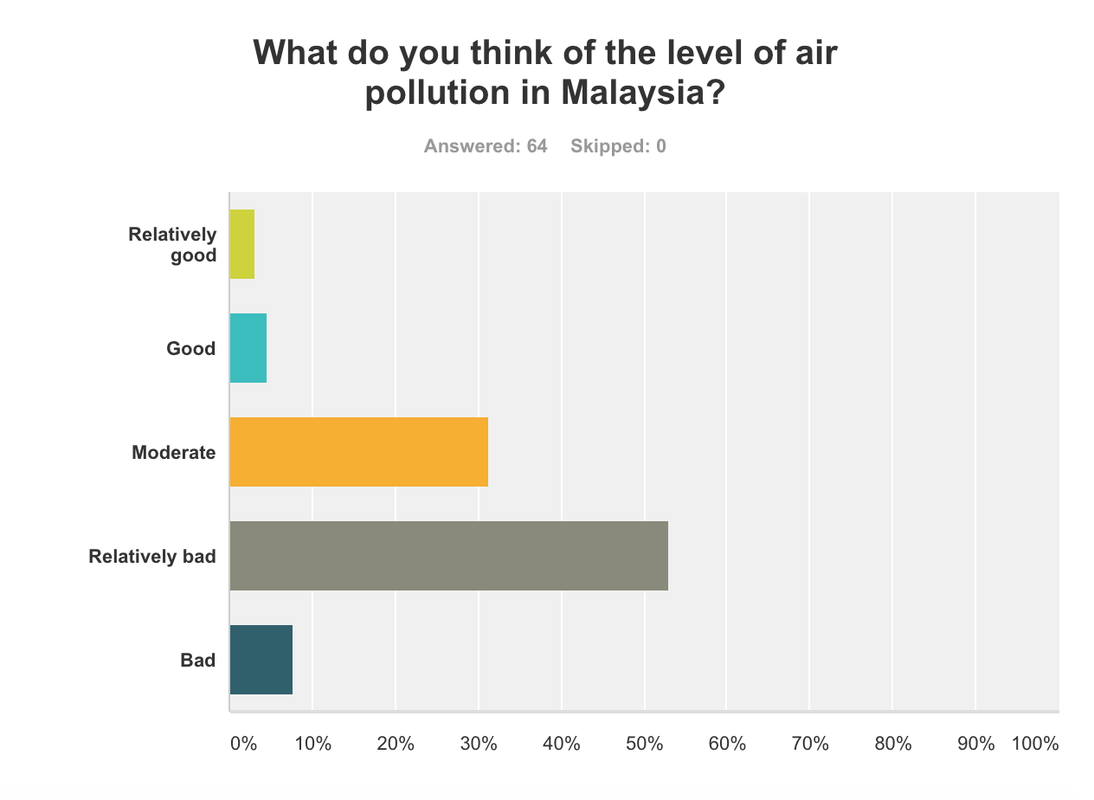
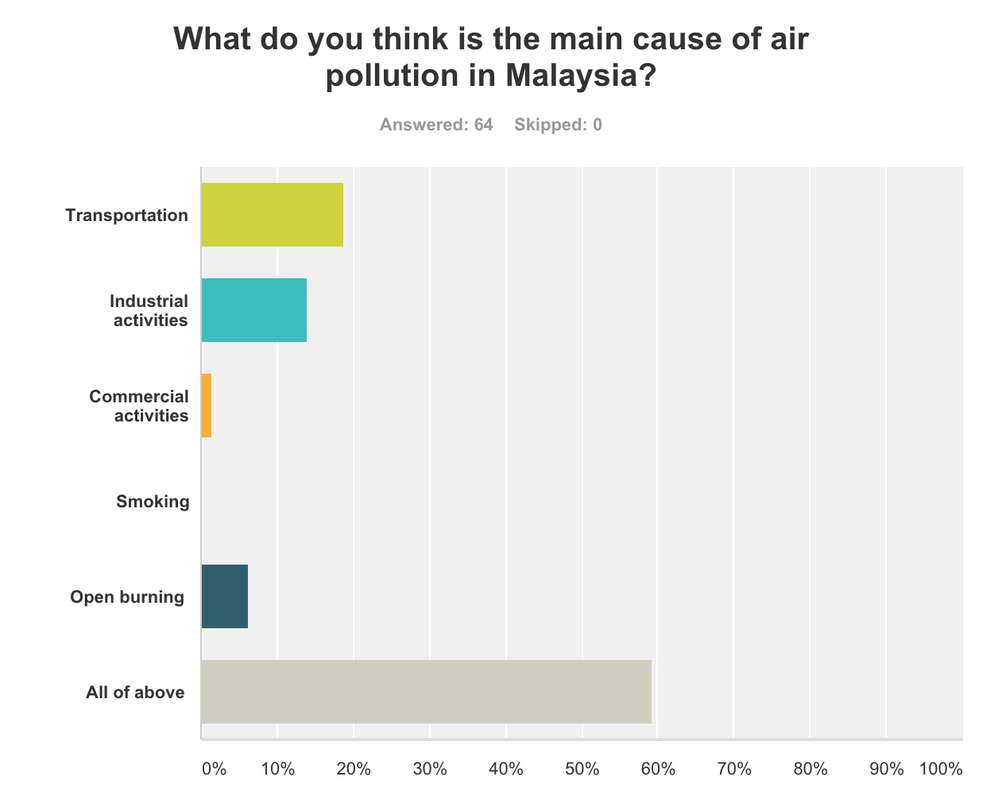
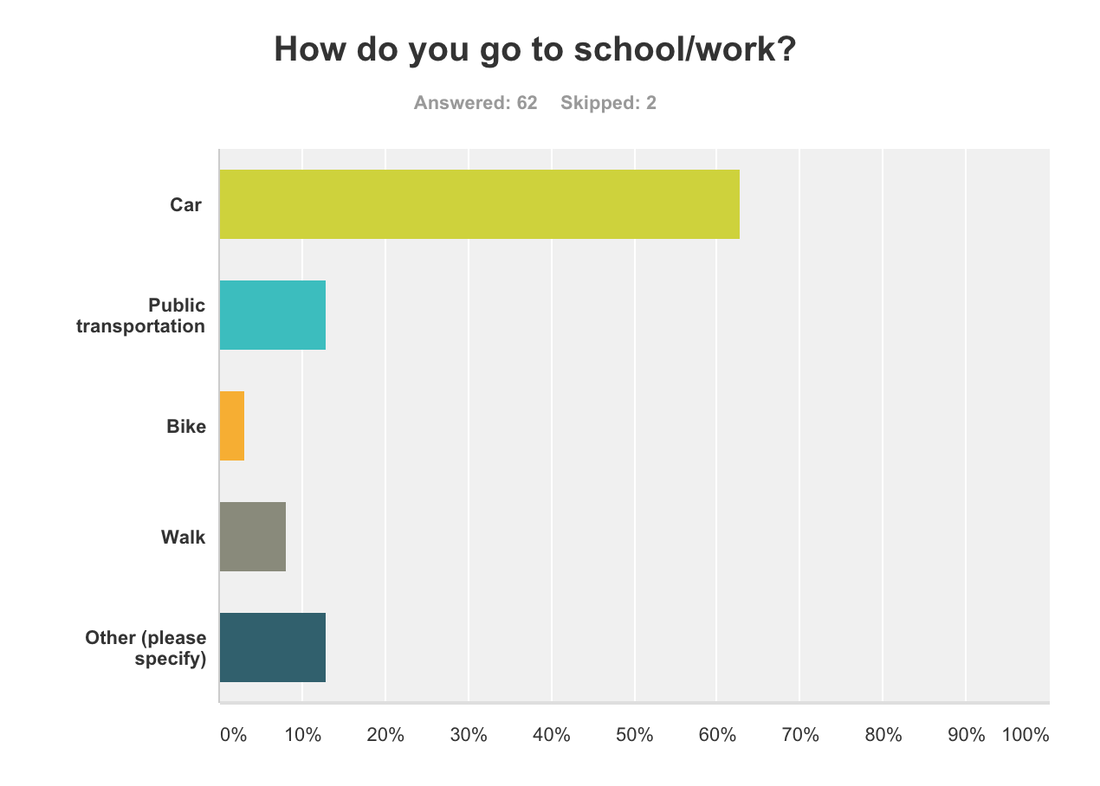
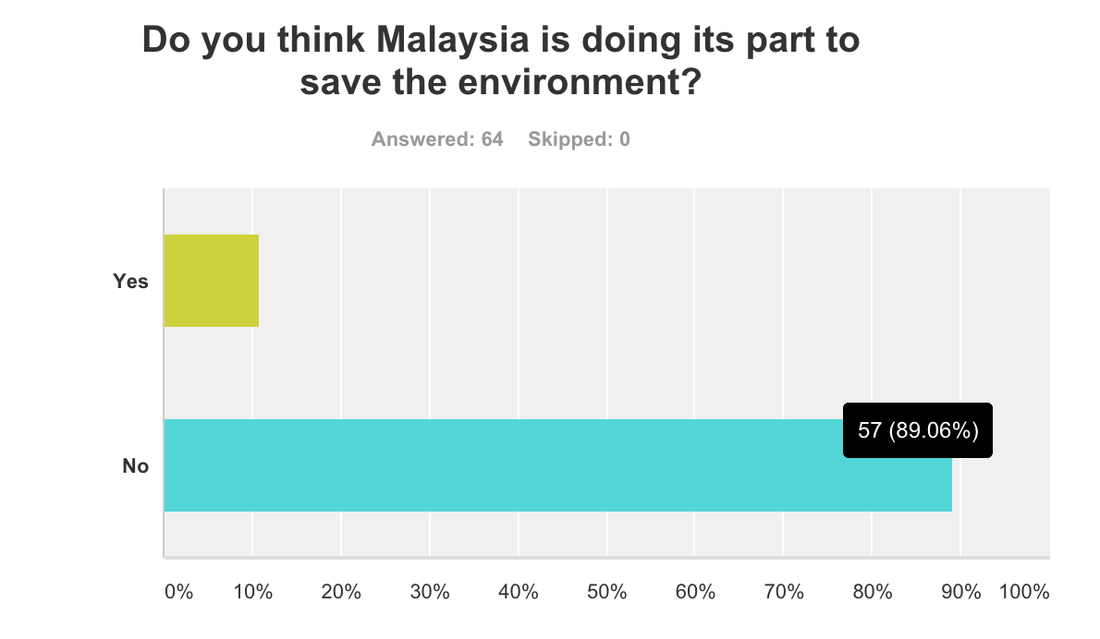
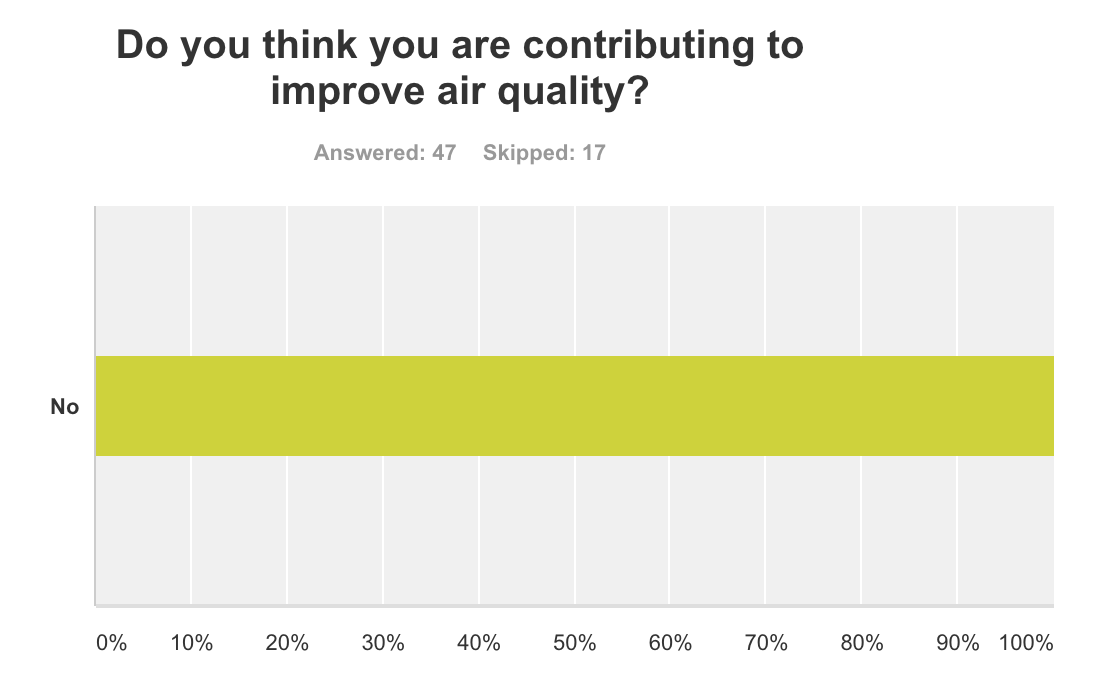
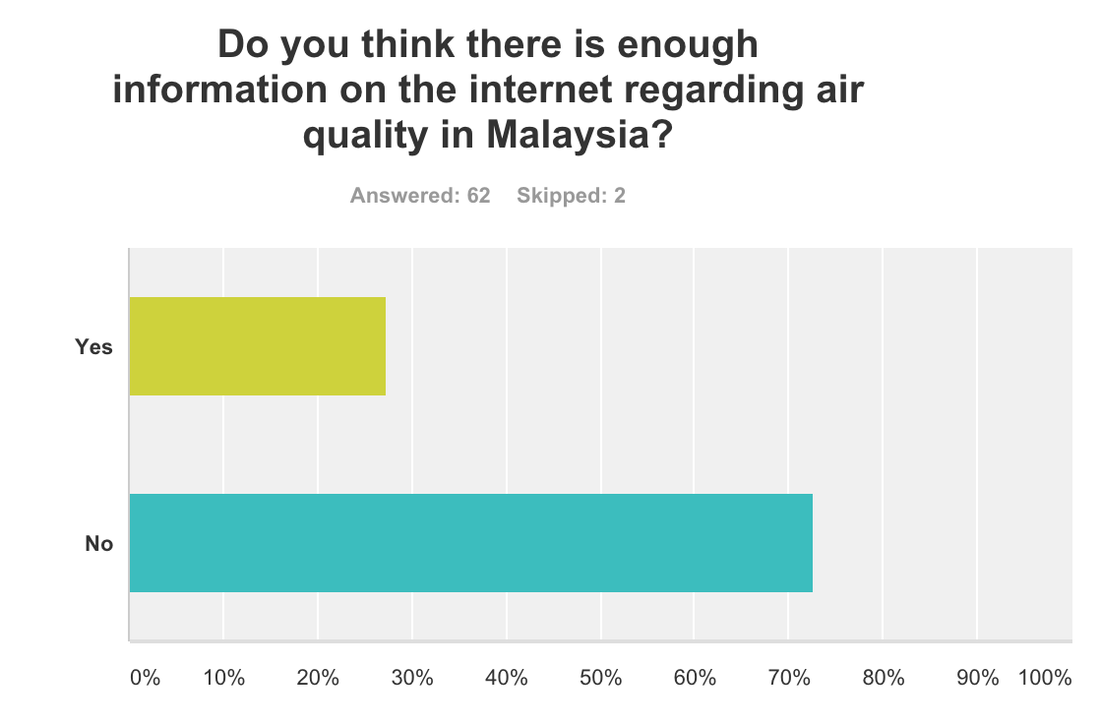
Survey Results